Cooling Tower Maintenance: Complete Operations, Troubleshooting & Optimization Guide
Introduction: From Theory to Reality
Remember that 500 MW plant we discussed in Part 1 that could lose 50 MW of capacity on a hot summer day? Well, last Tuesday at 2:47 PM, I watched exactly that happen to a perfectly designed cooling tower system. The theory was sound, the calculations were correct, the equipment was properly sized—but three months of deferred fill cleaning and a stuck damper motor turned a $3 million cooling system into a $400,000-per-day liability.
This is where theory meets the unforgiving reality of power plant operations. You can design the most thermodynamically perfect cooling tower in the world, but if you don’t know how to diagnose why the approach temperature is climbing on a humid afternoon, or why Cell #3 is consuming 40% more power than the others, that beautiful design becomes an expensive problem.
In Part 1, we built your theoretical foundation: vapor pressure gradients, approach temperatures, natural draft stack effects, and heat transfer principles. Those fundamentals are crucial—they’re what separate competent cooling tower engineers from technicians who just follow checklists. But theory alone doesn’t keep plants running when the ambient wet bulb hits 78°F and your condensing pressure starts climbing.
By the end of this guide, you’ll transform from someone who understands cooling tower theory to someone who can keep these systems running at peak efficiency under real-world conditions. Specifically, you’ll master:
- Systematic troubleshooting techniques that quickly identify root causes rather than symptoms—saving hours of diagnostic time and preventing wrong-direction repairs
- Predictive cooling tower maintenance strategies that catch problems before they impact plant performance, including the warning signs that separate experienced operators from beginners
- Performance optimization methods for different seasons and operating conditions, including the control strategies that maximize efficiency while minimizing parasitic losses
Ready to turn your theoretical expertise into practical operational competence? Let’s dive into the real world of cooling tower systems, where every decision has immediate consequences and operational excellence directly translates to career advancement and plant profitability.
System Components and How They Actually Fail
Let me share something I’ve learned over decades of troubleshooting cooling towers: the best-designed system in the world is only as reliable as its weakest component. And in cooling towers, every component will eventually fail in predictable ways. The key is knowing how to spot problems early and understand the real-world consequences of each failure mode.
A. Cooling Tower Fill Systems: The Heart of Heat Transfer
Film vs. Splash Fill Performance in Practice
Think of fill material as the engine of your cooling tower—everything else just supports this critical heat exchange process. In theory, both film and splash fill can provide excellent performance. In practice, your choice between them often determines whether you’ll be dealing with routine maintenance or emergency cleanouts.
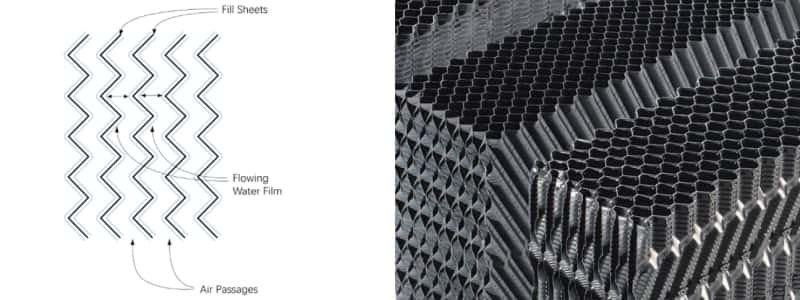
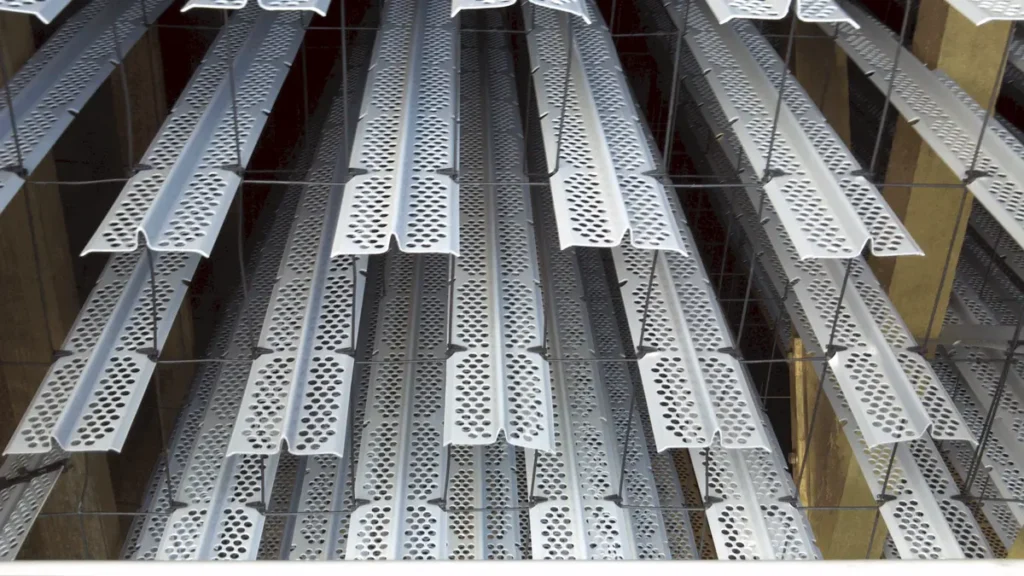
Film fill creates those thin water sheets we talked about in Part 1, maximizing surface area for heat transfer. When it’s clean and properly installed, film fill delivers 15-20% better thermal performance than splash fill in the same space. But here’s what the textbooks don’t tell you: film fill acts like a giant filter, capturing every piece of debris, every algae spore, and every scale particle in your cooling water system.
I’ve seen film fill installations go from design performance to 30% capacity loss in just six months due to fouling. The closely spaced sheets that make film fill so efficient also make it incredibly susceptible to plugging. Once plugging starts, it accelerates—restricted water flow creates dry spots, dry spots create localized heating, and hot spots become breeding grounds for biological growth.
Splash fill, on the other hand, breaks water into droplets that cascade through multiple levels of splash bars. It’s less thermodynamically efficient, but it’s forgiving. Debris passes through, biological growth gets physically scrubbed away by water action, and even moderate scale buildup doesn’t drastically affect performance.
My rule of thumb: Choose film fill when you have excellent water treatment and dedicated maintenance staff. Choose splash fill when you need reliability with minimal attention.
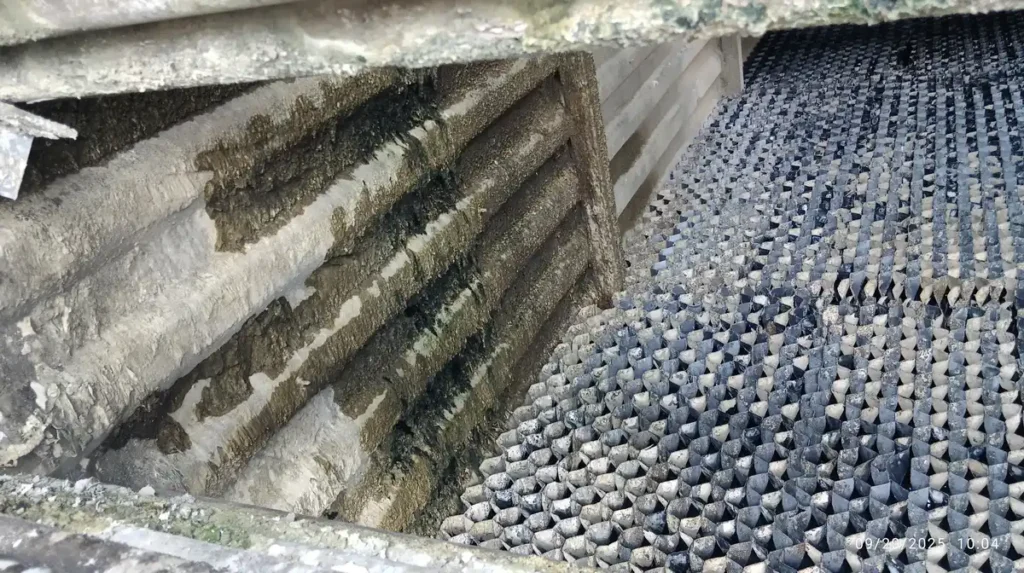
Common Failure Modes: Fouling, Biological Growth, Degradation
Let me walk you through the three failure modes that account for 80% of cooling tower fill problems I’ve encountered:
Fouling happens when suspended solids in the cooling water accumulate in the fill. With film fill, even fine particles can bridge between sheets, creating blockages that force water to channel through unrestricted areas. The result is uneven water distribution and reduced heat transfer surface area. I’ve measured approach temperature increases of 5-8°F from fouling alone.
Biological growth is insidious because it often starts where you can’t see it—in the warm, moist, low-flow areas of partially plugged fill. Algae, bacteria, and biofilms don’t just block water flow; they insulate the fill surfaces, reducing heat transfer efficiency. Worse, they create localized corrosion that can destroy fill material from the inside out.
Physical degradation occurs as cooling tower fill material ages under constant thermal cycling, UV exposure, and chemical attack from water treatment programs. I’ve seen 15-year-old film fill become brittle and start shedding pieces into the water system, creating fouling problems downstream in heat exchangers and pumps.
Inspection Techniques and Replacement Criteria
Here’s how to assess cooling tower fill condition like a seasoned professional:
Visual inspection from above: Look for uneven water distribution patterns. Dry spots indicate plugged areas. Excessive algae growth in certain sections suggests dead zones where water isn’t flowing properly.
Water quality sampling: Take samples from the bottom of different fill sections. Higher temperature, higher dissolved solids, or biological activity in specific areas indicates localized problems.
Performance trending: Monitor approach temperature and effectiveness over time. A gradual increase usually indicates fill fouling, while a sudden change suggests mechanical problems.
Replace fill when:
- Approach temperature has increased more than 3°F from baseline despite cleaning
- Physical deterioration is visible (cracking, sagging, material loss)
- Cleaning cycles are required more than twice per year
- Water distribution cannot be restored to acceptable uniformity
B. Water Distribution Systems
Nozzle Types and Real-World Performance Issues
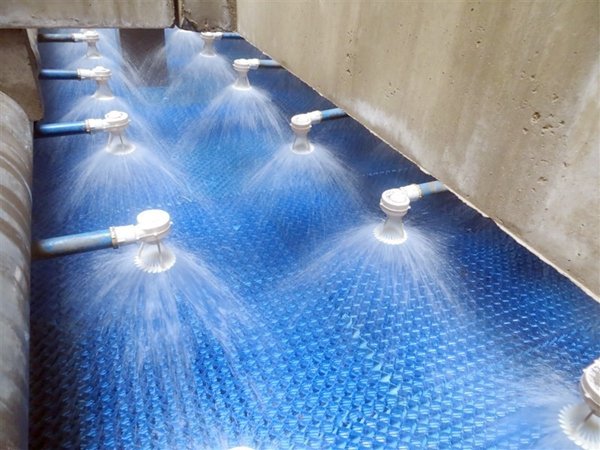
The water distribution system is where theory meets Murphy’s Law. In a perfect world, every square foot of cooling tower fill gets exactly the same water flow rate. In reality, nozzles plug, headers develop leaks, and distribution becomes uneven within months of startup.
Spray nozzles create fine droplets with good coverage patterns when they’re clean. But they have small orifices that plug easily with debris, scale, or biological growth. I’ve seen single plugged nozzles create 10-foot diameter dry spots in the fill below.
Splash nozzles have larger openings and are less prone to plugging, but they provide less uniform distribution and higher pressure drop. They’re my preference for plants with marginal water quality or limited maintenance resources.
Rotating nozzles theoretically provide the most uniform distribution, but they have moving parts that wear out and require regular maintenance. Unless you have dedicated cooling tower technicians, stick with fixed nozzles.
Uneven Distribution Diagnosis and Correction
Uneven water distribution is one of the most common—and most overlooked—cooling tower problems. Here’s how to diagnose it:
Temperature mapping: Use an infrared gun to measure cooling tower fill surface temperatures. Hot spots indicate areas with insufficient water flow. I’ve found temperature variations of 15-20°F across fill surfaces in poorly maintained systems.
Flow visualization: During maintenance outages, remove drift eliminators and observe water distribution patterns. You should see uniform coverage across the entire cooling tower fill area.
Pressure monitoring: Install pressure gauges on distribution headers. Significant pressure differences between headers indicate flow imbalances.
Correction techniques:
- Clean or replace plugged nozzles
- Install flow balancing orifices in high-flow headers
- Adjust header elevation to improve hydraulic balance
- Consider upgrading to pressure-compensating nozzles for critical applications
Pressure vs. Gravity Systems: Maintenance Considerations
Pressure systems pump water to elevated distribution headers, creating positive pressure at each nozzle. This provides uniform flow regardless of nozzle elevation and allows for better distribution control. However, they require more complex piping, higher pumping costs, and are more susceptible to problems from debris in the water.
Gravity systems rely on elevated distribution basins or headers. They’re simpler and more reliable, but they’re sensitive to levelness and header design. Small elevation differences create large flow variations.
From a maintenance perspective, gravity systems are more forgiving. Partially plugged nozzles still get some flow due to static head. In pressure systems, plugged nozzles can completely stop flow to entire sections.
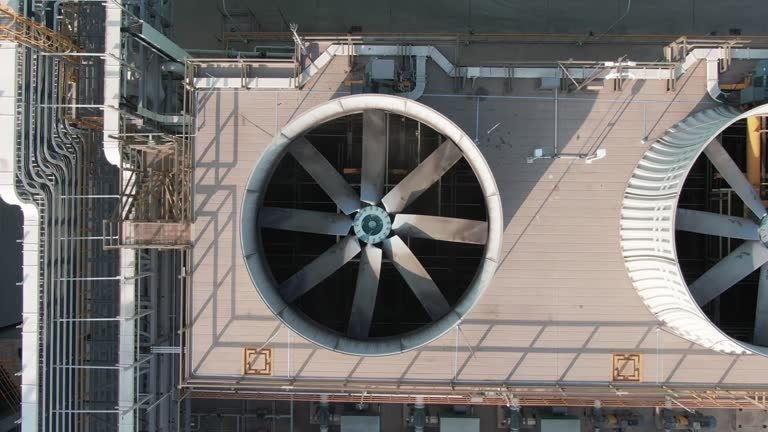
C. Air Movement Systems
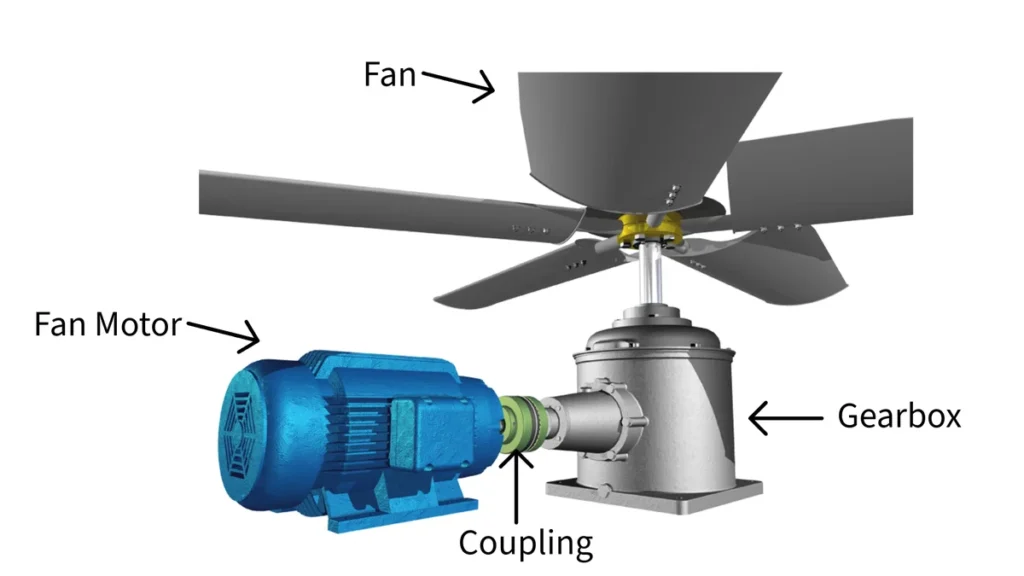
Cooling Tower Fan and Motor Common Failures
Cooling tower fans are workhorses that operate in the worst possible environment—hot, humid, corrosive air with constant moisture exposure. Here are the failure modes I see most often:
Motor failures typically result from moisture ingress, overheating, or electrical problems. The hot, humid exhaust air from cooling towers is brutal on motor windings. I’ve seen $50,000 motors fail within two years due to inadequate moisture protection.
Gearbox problems often start with lubricant degradation from heat and moisture contamination. Early symptoms include unusual noise, vibration, and metal particles in oil samples. A failed gearbox can destroy a motor and fan assembly, turning a $10,000 maintenance item into a $200,000 emergency replacement.
Fan blade issues range from erosion and corrosion to complete blade failure. Fiberglass blades can delaminate in humid conditions, while aluminum blades suffer from corrosion pitting. I’ve witnessed cooling tower fan blade failures that sent debris through the fill, causing extensive damage throughout the tower.
Vibration Analysis and Balancing Procedures
Vibration analysis is your early warning system for mechanical problems. Here’s what I look for:
Baseline measurements: Record vibration levels when equipment is new or after major maintenance. Any increase of more than 25% from baseline indicates developing problems.
Frequency analysis: Different problems create different vibration signatures:
- 1x running speed: unbalance or misalignment
- 2x running speed: bearing problems or bent shaft
- High frequency: bearing wear or gear mesh problems
Balancing procedures: Cooling tower fan unbalance is common due to blade erosion, ice buildup, or debris accumulation. Proper balancing requires:
- Stopping the fan and measuring runout
- Adding or removing weight at specific blade locations
- Verifying improvement with vibration measurements
- Documenting weight locations for future reference
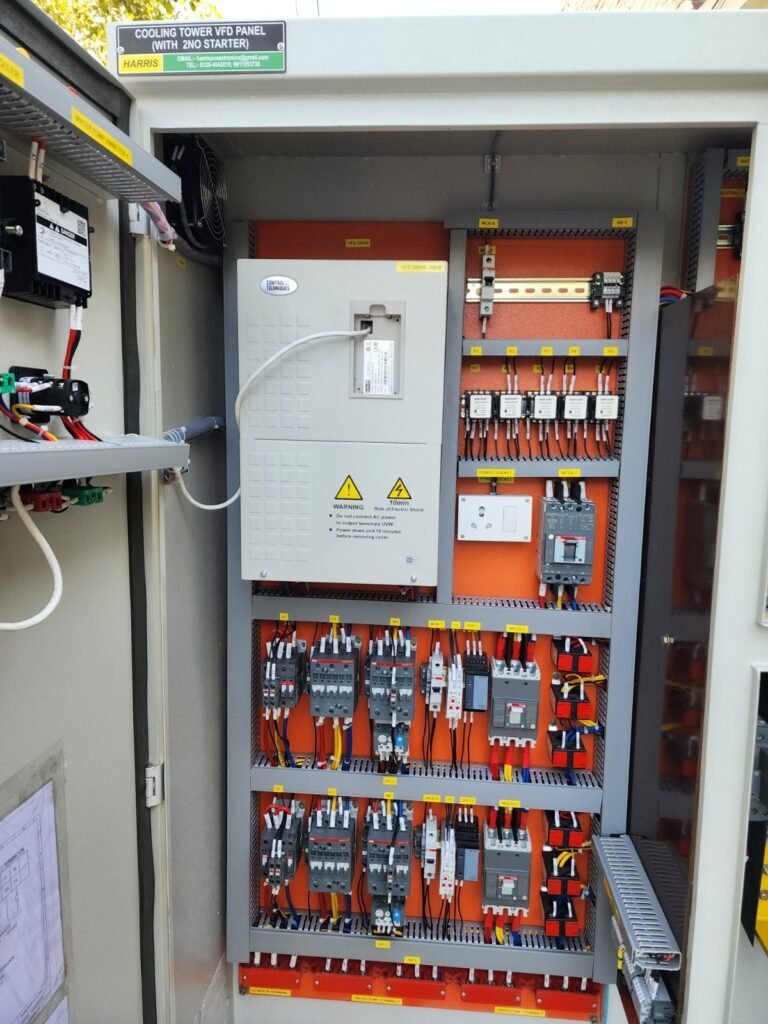
Variable Speed Drive Optimization Strategies
Variable frequency drives (VFDs) are game-changers for cooling tower efficiency, but they require proper setup and maintenance. Here’s what makes the difference:
Control strategy: Most plants run fans at fixed speed, missing huge efficiency opportunities. Proper VFD control adjusts fan speed based on cooling demand, potentially reducing fan power by 30-50% during moderate weather.
Motor protection: VFDs can create electrical stress on motors not designed for variable frequency operation. Install line reactors and dV/dT filters to protect motor windings.
Maintenance considerations: VFDs generate heat and are sensitive to environment. Install them in clean, climate-controlled spaces, not in outdoor enclosures near the cooling tower.
D. Structural and Support Systems
Basin Design Issues and Solutions
The cooling tower basin seems like the simplest component, but poor basin design causes more operational problems than you might expect.
Slope and drainage: Basins need proper slope (typically 1% minimum) toward suction points. Inadequate slope creates dead zones where debris accumulates and biological growth thrives. I’ve seen basins with insufficient slope require monthly cleaning instead of annual cleaning.
Suction design: Poor suction design creates vortices that entrain air into the cooling water system, reducing pump efficiency and increasing cavitation risk. Install proper suction bells and maintain adequate submergence.
Freeze protection: In cold climates, basin heaters prevent ice formation that can damage concrete and create safety hazards. Size heaters for your local winter conditions, not just freezing protection.
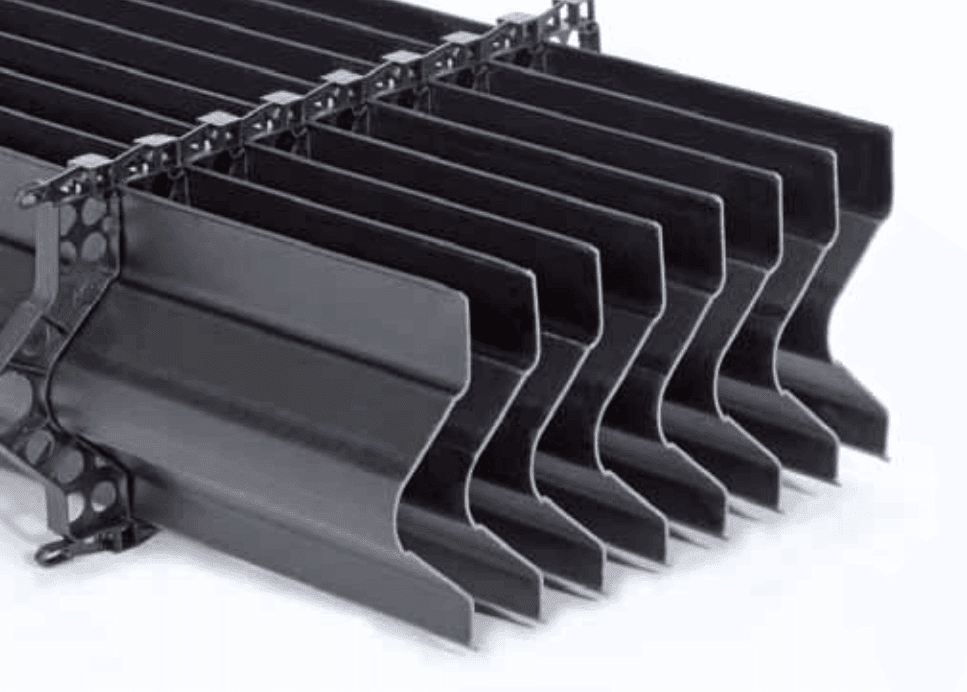
Drift Eliminator Maintenance and Replacement
Drift eliminators prevent water droplets from leaving the cooling tower, but they’re often neglected until problems become obvious.
Performance indicators: Excessive drift usually shows up as water stains on surrounding equipment, vegetation damage, or complaints from neighboring facilities. By the time you see these symptoms, you’ve likely been losing water for months.
Cleaning procedures: Drift eliminators collect debris and biological growth just like fill material. Regular cleaning prevents performance degradation and extends service life.
Replacement criteria: Replace eliminators when cleaning no longer restores performance or when physical damage is evident. Damaged eliminators can increase drift rates by 10-100 times design levels.
Freeze Protection and Winter Operation Challenges
Winter operation presents unique challenges that catch many operators off guard:
Ice formation: Ice can form on fill, fans, and structures even when basin water remains unfrozen. Ice loading can damage cooling tower fan blades and cause severe vibration problems.
Overcooling: In cold weather, cooling towers can cool water below desired temperatures, affecting condenser vacuum and plant efficiency. Install bypass systems or variable speed drives to control capacity.
Thermal shock: Rapid temperature changes during startup can crack concrete structures and damage cooling tower fill material. Develop gradual startup procedures for cold weather operation.
The key insight I want you to remember is this: every cooling tower component will eventually fail, but failure patterns are predictable. Understanding these patterns allows you to shift from reactive maintenance to predictive maintenance, preventing costly failures and maintaining peak performance year-round.
Comprehensive Troubleshooting Guide
When I get called to a plant with cooling tower problems, the first thing I do is resist the urge to start taking things apart. Most cooling tower problems have multiple possible causes, and fixing the wrong thing first can mask the real issue while wasting weeks of downtime and thousands of dollars in unnecessary repairs.
A. Performance Problems Diagnosis
High Approach Temperature: Systematic Diagnosis
High approach temperature is the most common performance complaint I encounter, and it’s also the most misdiagnosed. Here’s my systematic approach to save plants from expensive wrong-direction repairs:
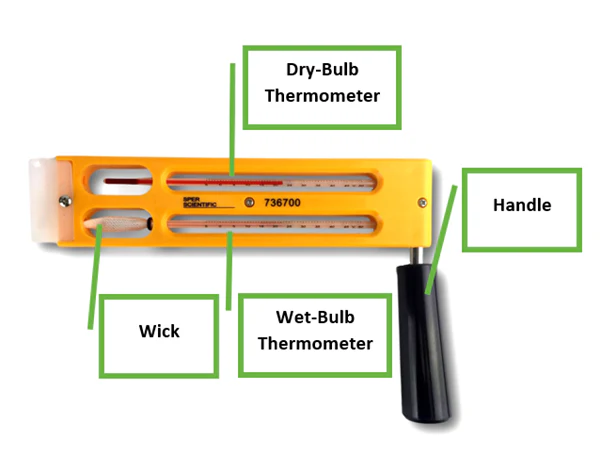
- Step 1: Verify the measurement Before you assume the cooling tower is the problem, confirm your instrumentation is accurate. Use a calibrated portable thermometer to verify both hot and cold water temperatures, and check wet bulb temperature with a sling psychrometer.
- Step 2: Establish baseline conditions Compare current performance to original design data and historical trends. An approach temperature that’s increased gradually over months indicates fouling or mechanical degradation. A sudden increase suggests a specific failure like a plugged nozzle or fan problem.
- Step 3: Check air flow first Air flow problems cause 60% of approach temperature issues I’ve diagnosed. Walk around the tower and feel for air discharge from each cell. Weak air flow from one cell usually indicates fan problems. No air flow indicates drive system failure.
- Step 4: Assess water distribution Remove drift eliminators during your next maintenance window and observe water distribution patterns. I use a simple grid of rain gauges placed across the cooling tower fill area—flow rates should be within 10% of each other. Significant variations indicate nozzle problems or header imbalances.
- Step 5: Evaluate fill condition Look for signs of plugging, biological growth, or physical degradation. Use temperature measurements across the fill surface—hot spots indicate areas with poor water distribution or plugged fill passages.
Diagnostic decision tree:
- Approach increased gradually + poor fill condition = Fill cleaning/replacement needed
- Approach increased suddenly + uneven air flow = Fan or drive system problem
- Approach increased + uneven water distribution = Distribution system repair needed
- Approach normal in cold weather but high in hot weather = Inadequate capacity for current conditions
Reduced Cooling Capacity: Step-by-Step Analysis
When plants complain about reduced cooling capacity, they’re usually seeing the symptoms without understanding the root cause. Here’s how to systematically identify what’s really happening:
- Step 1: Define the problem clearly “Reduced cooling capacity” can mean different things. Are you seeing higher condenser pressure? Lower plant output? Higher makeup water usage? Each symptom points to different root causes.
- Step 2: Check the fundamentals Verify that your heat load hasn’t increased due to condenser fouling, process changes, or ambient temperature effects. I’ve seen operators blame cooling towers for problems that were actually caused by dirty condensers or malfunctioning steam turbines.
- Step 3: Analyze the cooling tower heat balance Calculate your actual range and compare it to design values. If range is low with normal water flow, your heat load may be lower than expected. If range is high, you may have insufficient water flow or excessive heat load.
- Step 4: Measure actual vs. design water flow Use ultrasonic flow meters or pressure differentials across flow elements to verify actual circulation rates. Flow reductions of 10-15% can significantly impact cooling performance.
- Step 5: Assess seasonal effects Cooling tower capacity naturally decreases as wet bulb temperature increases. Verify that your expectations match the physics—a tower that performs perfectly at 70°F wet bulb will struggle at 78°F wet bulb.
Excessive Water Consumption: Leak Detection Methods
Water loss problems require detective work because the water can disappear through multiple paths. Here’s my systematic approach:
- Step 1: Quantify the loss Measure actual makeup water flow and compare it to theoretical requirements. For a properly operating tower, total water loss should be about 2-3% of circulation rate (1.5% evaporation + 0.5% drift + variable blowdown).
- Step 2: Check for obvious leaks Start with visible leaks in the basin, piping, and pump seals. Use dye testing for suspected underground leaks. A 1-inch diameter hole in a basin can waste 100,000 gallons per day.
- Step 3: Assess drift losses Excessive drift usually indicates damaged or missing drift eliminators. Look for water stains on nearby equipment and vegetation damage downwind of the tower.
- Step 4: Evaluate blowdown practices Manual blowdown operations are often excessive. Install conductivity controllers to automate blowdown and optimize cycles of concentration.
- Step 5: Monitor for system leaks Check condenser tube leaks that can increase makeup water requirements while masking cooling water losses.
Flow and Temperature Measurement Techniques
Accurate measurements are the foundation of effective troubleshooting. Here are the techniques I rely on:
Water flow measurement:
- Ultrasonic meters provide accurate, non-intrusive flow readings
- Pressure differential across calibrated flow elements
- Pump curve analysis using motor power and head measurements
Temperature measurement:
- Use RTDs or thermocouples at multiple locations to verify uniformity
- Handheld infrared thermometers for quick surface temperature mapping
- Temperature differential measurements across the tower range
Air flow assessment:
- Anemometer readings at multiple points across each cell
- Pitot tube measurements in ductwork (if accessible)
- Indirect assessment through cooling tower fan power consumption analysis
B. Mechanical Issues Resolution
Vibration and Noise Troubleshooting Flowcharts
Mechanical problems in cooling towers follow predictable patterns. Here’s my diagnostic flowchart approach:
High vibration at 1x running speed:
- Check for fan unbalance (most common cause)
- Verify motor/gearbox alignment
- Inspect for bent fan shaft
- Look for loose bolting or structural issues
High vibration at 2x running speed:
- Suspect bearing problems in motor or gearbox
- Check for misalignment between motor and gearbox
- Inspect fan hub for damage or looseness
High-frequency vibration:
- Usually indicates bearing wear or gear mesh problems
- Check lubrication levels and condition
- Listen for unusual noises during operation
Intermittent vibration:
- Often caused by loose components or structural resonance
- Check all bolting and mounting hardware
- Verify proper structural support and bracing
Motor and Drive System Problems
Motor failures in cooling tower service follow predictable patterns based on the harsh operating environment:
Moisture-related failures:
- Install motor space heaters when units are offline
- Use moisture-resistant motor designs rated for outdoor service
- Implement regular insulation resistance testing
Overheating problems:
- Verify adequate ventilation around motor enclosures
- Check for proper motor loading (should be 80-95% of nameplate)
- Clean motor cooling fins and ventilation openings regularly
Electrical issues:
- Install surge protection for VFD-driven motors
- Use dV/dT filters to protect motor windings
- Monitor power quality and phase balance
Gearbox problems:
- Establish oil sampling programs to detect wear particles
- Monitor oil temperature and level continuously
- Replace seals proactively to prevent moisture contamination
C. Water Quality Problems
Scale Formation: Prevention and Removal
Scale formation is one of the most insidious cooling tower problems because it develops gradually and affects multiple system components:
Understanding scale formation: Scale forms when dissolved minerals in cooling water exceed their solubility limits due to evaporation and temperature changes. Calcium carbonate is the most common culprit, but silica, calcium sulfate, and phosphate scales also occur.
Prevention strategies:
- Maintain proper cycles of concentration (typically 3-6 cycles)
- Use scale inhibitor chemicals matched to your water chemistry
- Control pH within optimal ranges (typically 7.5-8.5)
- Monitor Langelier Saturation Index to predict scaling tendency
Removal techniques:
- Mechanical cleaning for heavy scale deposits
- Chemical cleaning with inhibited acids for calcium carbonate scale
- Specialty cleaners for silica and other difficult scale types
- Consider temporary offline cleaning systems for severe cases
Biological Growth: Identification and Treatment
Biological growth in cooling towers creates operational problems and health hazards that require immediate attention:
Common types:
- Algae growth appears as green, brown, or black discoloration
- Bacterial slimes create slimy biofilms on surfaces
- Fungal growth often appears as white, cottony masses
- Legionella bacteria pose serious health risks
Identification techniques:
- Visual inspection for discoloration and biological masses
- Microbiological testing to identify specific organisms
- ATP testing for rapid assessment of biological activity
- Monitor for musty odors that indicate biological growth
Treatment programs:
- Maintain proper biocide residuals (typically 0.5-1.0 ppm free chlorine)
- Use biodispersants to penetrate existing biofilms
- Implement shock treatment programs for severe contamination
- Consider UV or ozone systems for supplemental disinfection
Corrosion: Causes, Detection, and Mitigation
Corrosion problems in cooling towers can affect performance and create safety hazards through structural damage:
Primary causes:
- Low pH conditions that promote acid corrosion
- High chloride concentrations from makeup water or treatment chemicals
- Microbiologically influenced corrosion from bacterial activity
- Galvanic corrosion between dissimilar metals
Detection methods:
- Regular inspection of metal components for pitting, thinning, or discoloration
- Corrosion coupon monitoring to measure corrosion rates
- Ultrasonic thickness testing of pipes and structural members
- Water chemistry monitoring for corrosive conditions
Mitigation strategies:
- Maintain proper pH and alkalinity levels
- Use corrosion inhibitor chemicals appropriate for your system metallurgy
- Install sacrificial anodes in areas prone to galvanic corrosion
- Consider protective coatings for steel structures
- Eliminate dissimilar metal connections where possible
The key to successful troubleshooting is systematic thinking and patience. Most cooling tower problems have obvious symptoms but hidden root causes. Take the time to gather data, analyze trends, and understand the complete picture before implementing solutions. This approach will save you time, money, and credibility with plant management.
Performance Optimization Strategies
Most plants operate cooling towers at fixed settings year-round, leaving enormous efficiency opportunities on the table. Plants parasitic power can be reduced by 20-30% and improve overall heat rate by 100-200 BTU/kWh through strategic seasonal optimization. The key is understanding that optimal operation in July looks completely different from optimal operation in February.
A. Seasonal Operation Optimization
Summer Peak Performance Strategies
Summer operation is when cooling towers earn their keep—and when every degree of approach temperature directly impacts plant revenue. During peak demand periods when electricity prices spike to $100-200 per MWh, cooling tower optimization becomes a financial imperative.
- Maximize air flow: Run all fans at full speed during peak hours, even if this seems excessive. The cost of fan power (typically $50-100/hour) is trivial compared to the value of maintaining full plant output ($5,000-10,000/hour revenue for a 500 MW plant).
- Optimize cycles of concentration: During hot weather, reduce cycles of concentration by 1-2 cycles to improve heat transfer. The increased water consumption costs $100-200/day but can recover 1-2 MW of capacity worth $2,000-4,000/day.
- Pre-cool before peak hours: If your plant has variable load capability, run extra cooling capacity during morning hours to pre-cool the system, building a thermal buffer for afternoon peak demand.
What Are Cycles of Concentration?
Cycles of concentration measure how many times dissolved solids have concentrated in your cooling water compared to the makeup water feeding the system.
Example:
- Makeup water has 200 ppm total dissolved solids (TDS)
- Cooling water measures 1,000 ppm TDS
- Cycles of concentration = 1,000 ÷ 200 = 5 cycles
As water evaporates in the cooling tower, it leaves all dissolved minerals behind, concentrating them in the remaining water.
Why Reducing Cycles Improves Heat Transfer
- Lower Surface Tension Water with fewer dissolved solids has lower surface tension, which allows it to spread more uniformly over cooling tower fill surfaces. Better wetting of the fill means more surface area for evaporation and heat transfer.
- Reduced Scale Formation Risk At high cycles (6-8+), you’re operating closer to mineral solubility limits. Even if you’re not getting visible scale, you may have microscopic scale formation on fill surfaces that acts as an insulating layer, reducing heat transfer efficiency.
- Better Water Film Characteristics Fresher water (lower TDS) forms thinner, more uniform films on fill material, which is exactly what you want for efficient evaporative cooling.
Winter Operation and Capacity Modulation
Winter presents the opposite challenge—too much cooling capacity can actually hurt plant efficiency by overcooling the condenser and reducing vacuum beyond optimal levels.
- Capacity reduction strategies: Stage fans off sequentially as ambient temperature drops. A tower designed for 95°F operation only needs 40-50% fan capacity at 40°F ambient. This can save 200-300 kW in fan power during winter months.
- Freeze protection protocols: Maintain minimum water velocity through all distribution systems. Consider installing basin heaters sized for local winter conditions—typically 50-100 watts per square foot of basin area.
- Optimize for efficiency: Winter is when you can achieve approach temperatures of 3-5°F. This improves plant heat rate significantly—use this to your advantage by maximizing generation during high-price winter peak periods.
Shoulder Season Efficiency Improvements
Spring and fall offer the best opportunities for efficiency optimization because ambient conditions are moderate and cooling demand is manageable with minimal parasitic power.
- Variable speed operation: This is when VFDs show their real value. Run fans at 40-60% speed during moderate weather, reducing fan power consumption by 75-85% compared to full-speed operation (remember: fan power varies with the cube of speed).
- Cell staging optimization: Operate only the minimum number of cells needed to maintain target approach temperature. Each idle cell eliminates drift losses and reduces water treatment costs while maintaining adequate capacity.
- Maintenance scheduling: Use shoulder seasons for aggressive cooling tower fill cleaning, nozzle maintenance, and system optimization when reduced capacity has minimal impact on plant operations.
B. Advanced Control Strategies
Variable Speed Fan Control Optimization
Modern VFD control systems can reduce annual fan energy consumption by 30-40% compared to fixed-speed operation, but only if properly programmed.
- Control algorithm: Set fan speed to maintain target approach temperature (typically 8-10°F) rather than running at fixed speed. Use a PID controller with these recommended settings: proportional band of 5°F, integral time of 120 seconds, no derivative action.
- Multiple cell coordination: When operating multiple cells, run all fans at the same reduced speed rather than running some at full speed and others off. This provides better air distribution and more efficient operation.
- Load-following capability: Configure controls to automatically adjust fan speed based on circulating water flow, allowing the cooling system to track plant load changes efficiently.
Smart Monitoring and Predictive Maintenance
Advanced monitoring systems transform cooling tower maintenance from reactive to predictive, catching problems before they impact performance.
- Critical parameters to trend: Monitor approach temperature, range, fan power consumption, water flow, and makeup water usage continuously. Establish baseline values and set alarms for 10% deviations from normal.
- Predictive indicators: Gradual approach temperature increases (0.5°F per month) indicate developing fouling. Increasing fan power at constant speed suggests mechanical problems. Rising makeup water consumption signals drift or leak issues.
Cooling Tower Preventive Maintenance Schedule
Daily Inspections (15-30 minutes):
| Activity | Action Required | Critical Parameters |
|---|---|---|
| Visual Walk-Around | Check for unusual noise, vibration, or leaks | Note any changes from normal |
| Temperature Monitoring | Record hot water, cold water, and wet bulb temps | Log in operations database |
| Water Level Check | Verify proper basin water level | Maintain 12-18″ above suction |
| Makeup Water Flow | Monitor makeup water flow rate | Compare to historical baseline |
| Fan Operation | Confirm all fans running smoothly | Listen for unusual sounds |
| Water Distribution | Observe distribution pattern uniformity | Check for dry spots or channeling |
| Drift/Plume Observation | Check for excessive drift losses | Look for water stains nearby |
Weekly Inspections (2-3 hours):
| Activity | Action Required | Inspection Points |
|---|---|---|
| Fill Inspection | Visual check for fouling or damage | Look for biological growth, debris |
| Nozzle Check | Verify all nozzles are flowing | Replace plugged nozzles |
| Fan Vibration | Measure vibration on bearings | Record readings, compare to baseline |
| Motor Temperature | Check motor housing temperature | Should be <20°F above ambient |
| Gearbox Inspection | Check oil level, listen for noise | Look for leaks or unusual sounds |
| Basin Cleaning | Remove debris and sediment | Prevent suction strainer clogging |
| Water Quality Testing | pH, conductivity, biocide residual | Adjust treatment as needed |
| Blowdown Verification | Confirm proper cycles of concentration | Adjust blowdown rate if needed |
Condition-Based Maintenance Triggers:
| Condition | Trigger Point | Action Required |
|---|---|---|
| Approach Temperature | >3°F increase from baseline | Investigate and correct cause |
| Fan Vibration | >25% increase from baseline | Balance or repair immediately |
| Motor Temperature | >30°F above ambient | Reduce load or repair |
| Gearbox Oil Analysis | >25 ppm iron or water present | Change oil, inspect internals |
| Water Consumption | >10% increase from normal | Investigate leaks or drift issues |
| Biological Growth | Visible growth on fill | Immediate cleaning and treatment |
| Scale Formation | Visible deposits on fill | Clean fill, adjust water treatment |
Key Performance Indicators to Track
- Approach temperature trend
- Range stability
- Fan power consumption
- Water consumption rate
- Makeup water flow
- Cycles of concentration
- Maintenance costs
- Unplanned downtime hours
C. Retrofit and Upgrade Options
Cooling Tower Fill Upgrade Decision Criteria
Cooling tower fill replacement represents a significant investment, but the payback can be compelling when performance has degraded substantially.
Replace fill when:
- Cleaning no longer restores performance
- Approach temperature has increased more than 3°F from baseline or physical deterioration is visible.
- Calculate payback by comparing the cost of lost efficiency (typically $200,000-500,000 annually per °F of approach increase) against upgrade cost.
Modern fill options: High-efficiency film fills can improve thermal performance by 15-20% over old splash fill, reducing approach temperature by 2-3°F. For poor water quality applications, consider advanced splash fills that offer 80% of film fill performance with better fouling resistance.
Fan and Motor Efficiency Improvements
Fan system upgrades often provide the fastest payback of any cooling tower improvement, particularly when replacing old, inefficient equipment.
- Energy-efficient motors: Premium efficiency motors (IE3 or better) cost 15-20% more than standard motors but reduce energy consumption by 3-5%. For motors operating 8,000+ hours annually, payback is typically under two years.
- Fan blade upgrades: Modern composite fan blades can improve air flow efficiency by 10-15% while reducing weight and maintenance requirements. This translates to either lower approach temperature or reduced fan power consumption.
- VFD retrofits: Adding variable speed drives to fixed-speed fans typically costs $50,000-100,000 per fan but can reduce annual fan energy costs by 30-40%, providing 2-3 year payback periods.
The fundamental principle of cooling tower optimization is this: treat your cooling system as a dynamic asset that requires continuous adjustment to match changing conditions, not a static installation that runs the same way year-round. Plants that embrace this philosophy consistently outperform those that don’t by 1-2% in overall efficiency—worth millions annually in a competitive electricity market.
Conclusion and Career Development
You now possess the operational competencies that separate competent cooling tower engineers from exceptional ones: systematic troubleshooting that identifies root causes quickly, predictive maintenance strategies that prevent failures before they impact operations, and optimization techniques that maximize efficiency while minimizing costs. These aren’t just technical skills—they’re the business capabilities that plant managers value when making hiring and promotion decisions.
The path to becoming a recognized cooling systems expert requires continuous learning. Pursue professional certifications from the Cooling Technology Institute (CTI) or ASHRAE, which provide industry-recognized credentials. Attend annual conferences like PowerGen or EPRI cooling water workshops where you’ll learn emerging technologies and network with industry leaders. Most importantly, seek mentorship from experienced plant engineers who can share the practical wisdom that only comes from decades of hands-on troubleshooting.
Your career progression in cooling systems typically follows this pathway: start as a plant engineer learning fundamentals through daily operations, advance to specialist roles focused on thermal system optimization, then move into consulting or management positions where you guide cooling system strategies across multiple facilities. Engineers who master both theoretical foundations and practical operations command premium salaries and enjoy strong job security—power plants will always need experts who can keep critical cooling systems running efficiently.
The cooling tower expertise you’ve built through this series positions you for long-term career success in power generation. Now go apply it.