Cooling Tower Fundamentals: Theory and Design for Power Plant Engineers
Author |Rotormind
Introduction: The Engineering Foundation You Need
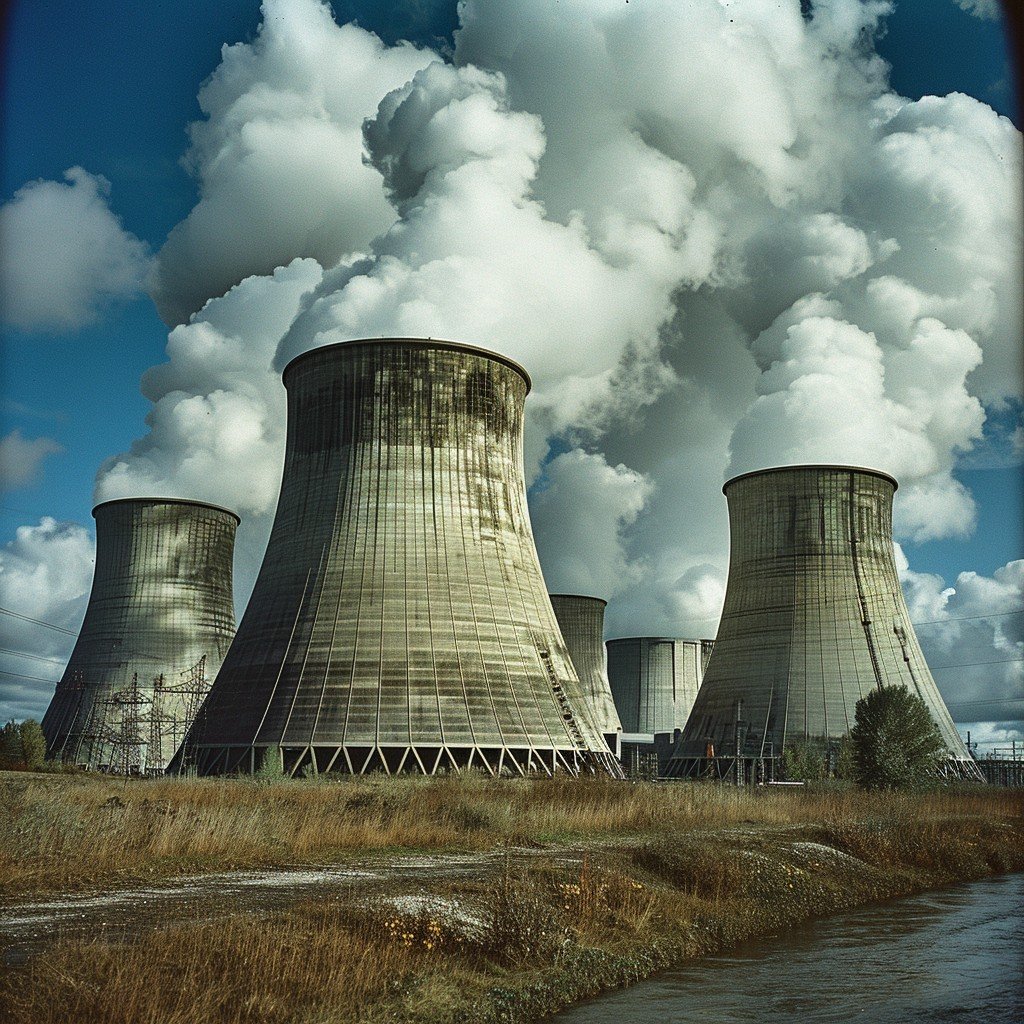
Picture this: You’re driving past a power plant and see those massive, hourglass-shaped concrete structures releasing what looks like enormous clouds of white “steam” into the sky. Most people barely give them a second glance, but as an engineer, you’re looking at some of the most critical—and underappreciated—components in the entire power generation process.
When a 500 MW plant loses 50 MW of capacity on a hot summer day due to poor cooling performance, the difference between knowing what’s happening versus why it’s happening can mean the difference between a quick fix and a million-dollar emergency retrofit. Understanding the fundamental principles of heat transfer, thermodynamics, and system design allows you to make informed decisions about cooling system selection, predict performance under different conditions, and communicate effectively with vendors, operators, and management.
By mastering this theoretical foundation, you’ll be able to:
Select the optimal cooling system for any power plant application, considering economics, performance, and environmental constraints
Calculate cooling requirements and size systems for worst-case operating conditions
Evaluate vendor proposals with confidence and ask the right technical questions
Predict performance trade-offs between wet, dry, and hybrid cooling approaches
Understand the economic implications of cooling system decisions over a 25-year plant lifecycle
Whether you’re a recent graduate preparing for your first power plant assignment, an experienced engineer expanding into thermal systems, or a student trying to understand how these massive systems actually work, this guide will give you the foundation and confidence to tackle real-world cooling tower challenges.
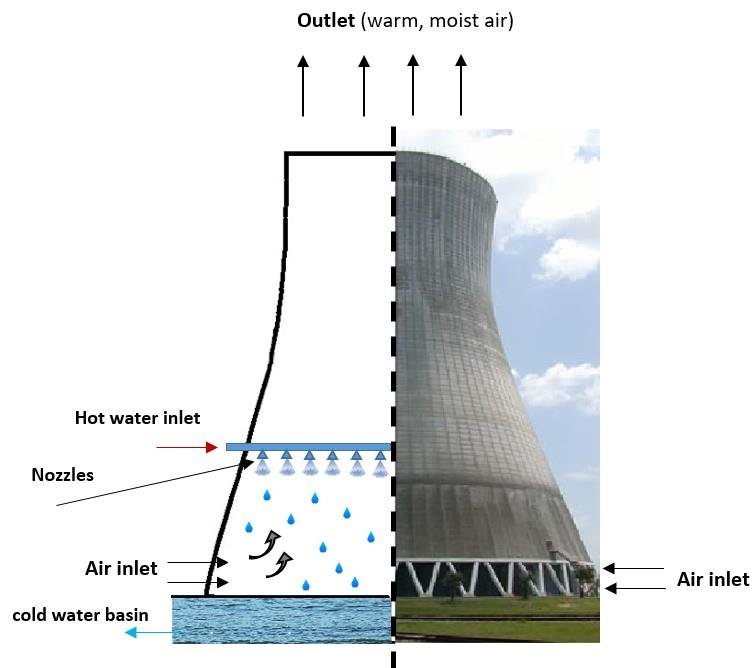
Let’s Clear the Air: It’s Not Steam! Those dramatic white clouds billowing from cooling towers aren’t steam at all. They’re water vapor that has condensed into tiny, visible droplets when hot, humid air from the cooling tower meets cooler ambient air. It’s exactly the same phenomenon you observe when you exhale on a cold winter day—your warm, moist breath becomes visible as tiny water droplets, not because you’re producing steam, but because of condensation.
True steam is completely invisible. By the time water vapor becomes visible, it has already condensed back into liquid water droplets suspended in air. This is why you can see cooling tower plumes from miles away on cool, humid days, but they might be nearly invisible on hot, dry days when the ambient air can hold more moisture.
Cooling Towers Releasing Huge Amount of Water Vapor (Not Steam!)
Fundamentals: The Science Behind Cooling
Now that we’ve established the importance of cooling towers, let’s roll up our sleeves and understand exactly how these systems work fundamentally. Think of this section as your foundation course—we’re going to build your understanding step by step, just like I did when I started in this industry years ago. Trust me, once you grasp these fundamentals, everything else about cooling towers will start making perfect sense.
A. Heat Transfer Principles
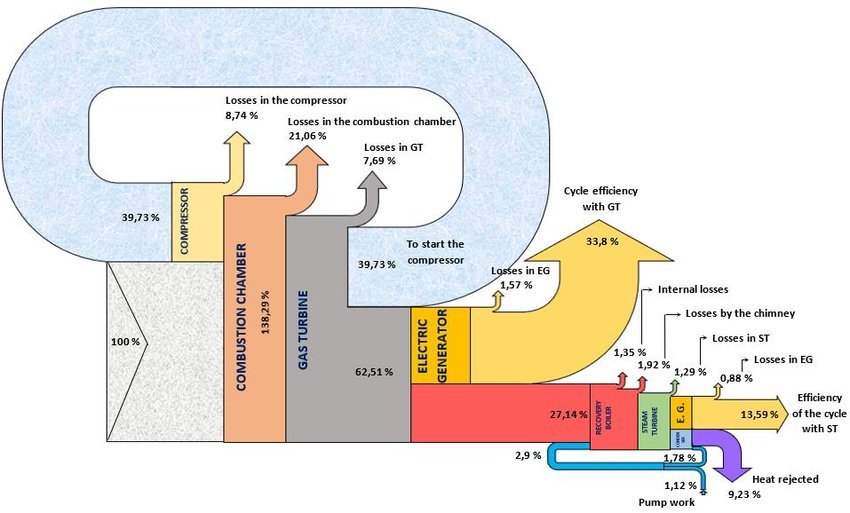
Thermodynamic Cycle Overview: Where Cooling Fits in the Power Cycle
Let me start with a question I ask every new engineer: “What’s the primary product of a power plant?” Most say “electricity,” but here’s the reality that might surprise you—power plants are actually heat rejection facilities that happen to produce electricity as a byproduct.
Here’s what I mean: In a typical steam cycle power plant, we only convert about 35-40% of the fuel’s energy into electricity. The remaining 60-65%? That’s waste heat that we absolutely must get rid of, or our entire system shuts down. It’s like trying to run a car engine without a radiator—disaster waiting to happen.
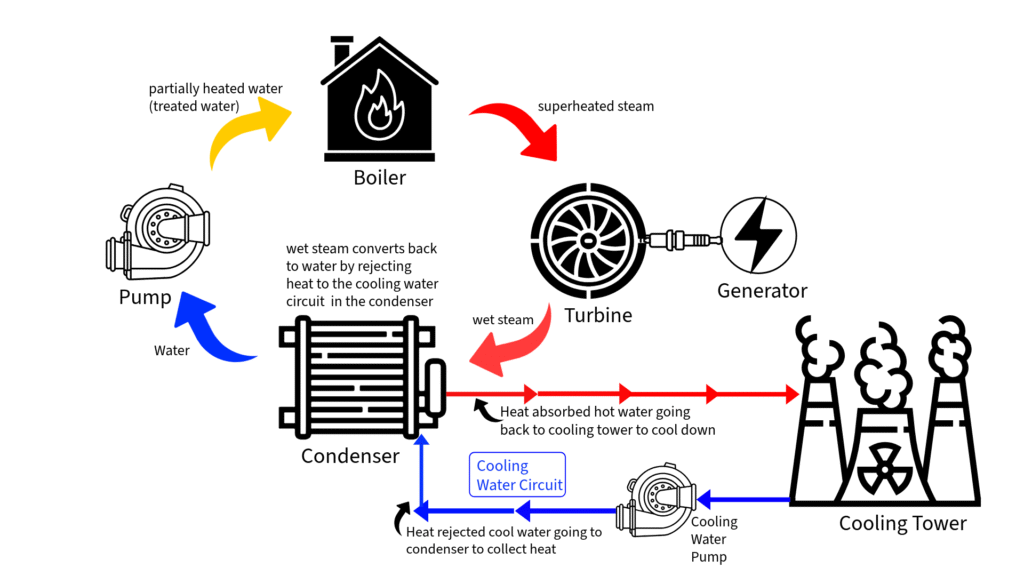
Let’s walk through the cycle together:
Steam Generation: We burn fuel (coal, gas, nuclear reaction) to create high-pressure, high-temperature steam
Power Generation: That steam expands through a turbine, spinning a generator to create electricity
Condensation: The exhausted steam—still very hot—must be condensed back to liquid water
Heat Rejection: This is where our cooling tower enters the picture
Power plant thermodynamic cycle diagram showing cooling tower’s role in heat rejection
Here’s the critical point: The condenser can only function if we continuously remove the heat of condensation. Without effective cooling, steam pressure builds up, turbine efficiency plummets, and eventually, the unit trips offline.
The cooling tower essentially closes this thermodynamic loop, allowing us to reject waste heat to the atmosphere and maintain the vacuum conditions necessary for efficient turbine operation.
Confusion Buster Box: “Why Can’t We Just Reheat the Steam and Use It Again?”
“This seems wasteful! We’re taking perfectly good steam from the turbine exit, cooling it down to water, then heating it back up to steam again. Why can’t we just take that exit steam, add some heat and pressure, and send it right back to the turbine inlet? We’d save all that cooling energy!”
Steam vs. Water: The Compression Problem
Water is virtually incompressible, meaning it takes very little energy to pump liquid water from 1 psi to 1,000 psi—typically less than 1% of a power plant’s total output.
Steam, however, is highly compressible, and trying to compress low-pressure steam back to high pressure would require enormous energy input, potentially 60-80% of the plant’s electrical output.
These phase properties answer our question why can’t we add pressure easily to low-pressure turbine exit steam without changing its phase.
Even if engineers actually attempted to take low-pressure steam and compress it directly back to turbine inlet conditions, the results would be catastrophic for plant economics. The massive compressors required would consume most of the electrical output the plant was trying to produce, and the compression process itself would generate enormous amounts of additional heat that would require even more cooling capacity. The equipment needed for steam compression would be larger and more expensive than entire cooling systems, and in the end, you’d likely achieve negative net power output—essentially running a very expensive machine that consumes more energy than it produces.
The brilliant engineering solution is condensation, which essentially “resets” the thermodynamic state of the working fluid. By condensing steam back to water, we can use simple, efficient liquid pumps instead of massive gas compressors to return the working fluid to high pressure.
The Bottom Line: The cooling and condensation step isn’t waste—it’s what makes the entire cycle possible! Without it, we’d have no practical way to get working fluid back to high pressure for the turbine. The energy “lost” in cooling is actually the fundamental requirement that allows us to extract net energy from the cycle.
Heat Rejection Requirements: Why Power Plants Need Massive Cooling Capacity
When I explain this to new engineers, I always use this analogy: If a 1,000 MW power plant were a person, it would need to sweat off the equivalent of 1,400 pounds of water every single minute just to stay cool. That’s the scale we’re dealing with.
This means 1,400 MW of waste heat must be rejected continuously
One MW of heat rejection typically requires cooling about 500 gallons per minute of water
Therefore, our 1,000 MW plant needs to cool 700,000 gallons per minute of circulating water
To put this in perspective, that’s enough water to fill an Olympic-sized swimming pool every 3.5 minutes, 24/7, 365 days a year.
But here’s what really drives the massive scale: The temperature difference available for heat rejection is relatively small. We’re typically trying to cool water from about 95°F down to 75°F using ambient air that might be 85°F. That small temperature difference means we need enormous surface area and airflow to transfer all that heat—hence those massive cooling towers.
The Three Heat Transfer Modes: Conduction, Convection, and Evaporation in Cooling Towers
Now let’s get to the heart of how cooling towers actually work. Every cooling tower relies on three heat transfer mechanisms working together, but here’s the key insight that took me years to fully appreciate: evaporation does about 80% of the work.
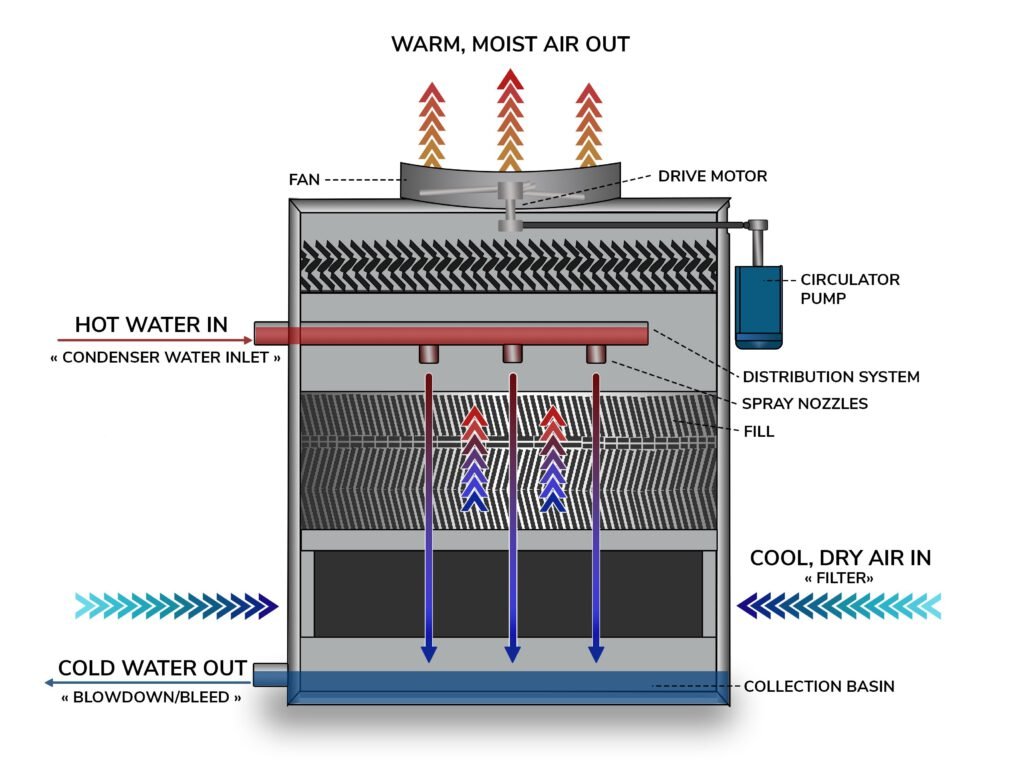
1. Conduction (The Direct Contact) When hot water droplets touch the air directly, heat conducts from the warmer water to the cooler air. This is straightforward thermal conduction—like touching a hot surface. In cooling towers, this happens as water flows over fill material and contacts air directly.
2. Convection (The Air Movement) As air absorbs heat, it becomes less dense and rises (natural convection), or we force it to move with fans (forced convection). This carries the heated air away and brings fresh, cooler air into contact with the water. Think of it as the transport mechanism that keeps fresh air coming and heated air leaving.
3. Evaporation (The Heavy Lifter) Here’s where the magic happens: When water evaporates, it carries away approximately 1,000 BTU per pound of water vaporized. This is enormous compared to simply heating air. To raise a pound of air by 1°F only takes about 0.24 BTU.
Cooling tower heat transfer mechanism
The Real Driving Force: Vapor Pressure Difference
Evaporation in cooling towers isn’t driven by temperature difference – it’s driven by vapor pressure difference between the water surface and the surrounding air.
Here’s what actually happens:
1. Water Surface Vapor Pressure:
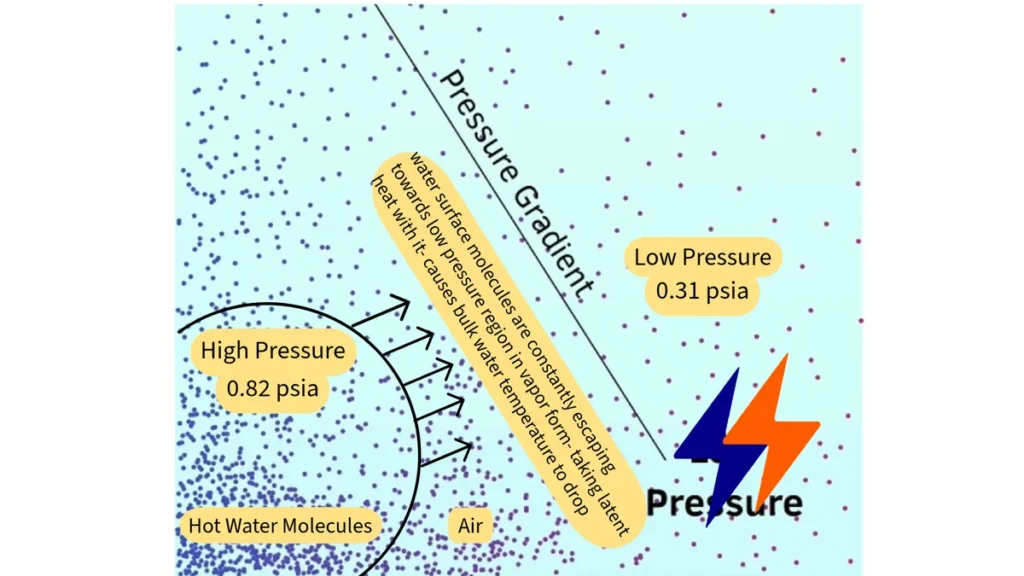
Every water surface has molecules constantly escaping into vapor form
Let’s say hot water temperature is 95°F. At 95°F, water has a saturation vapor pressure of about 0.82 psia
This means the air directly at the water surface wants to hold a specific amount of water vapor
2. Ambient Air Vapor Pressure:
The ambient air at 85°F with 60% relative humidity has a partial vapor pressure of only about 0.31 psia
This air is “hungry” for more water vapor – it’s not saturated
3. The Pressure Gradient:
Vapor pressure at water surface: 0.82 psia
Vapor pressure in bulk air: 0.31 psia
Pressure difference: 0.51 psia drives the evaporation
The Actual Process: When water molecules evaporate from the 95°F water surface, they absorb 1,000 BTU/lb from the liquid water around them (not from the air). This energy comes from the kinetic energy of the remaining water molecules, which causes the bulk water temperature to drop. The newly formed water vapor then mixes with the air and gets carried away by airflow.
Why This is So Powerful: Even if the air temperature equals the water temperature (95°F), evaporation continues as long as the air isn’t 100% saturated with water vapor. The vapor pressure gradient keeps driving evaporation, and each evaporating molecule keeps pulling 1,000 BTU from the remaining liquid water.
Vapor Pressure Gradient: The Driving Force for Evaporation
Key Insight: The heat for phase change (evaporation) comes from the water itself, not from temperature difference with air. This is why cooling towers can cool water below ambient air temperature – they’re limited by wet bulb temperature (which accounts for humidity), not dry bulb temperature.
Let me give you a practical example from my experience: In a typical cooling tower, about 1.5% of the circulating water evaporates. For our 700,000 GPM example, that’s roughly 10,500 gallons per minute turning to vapor. Each gallon that evaporates removes about 8,300 BTU of heat—that’s why evaporation is so incredibly effective.
Straight from the Field: Always remember that evaporation rate—and therefore cooling capacity—depends heavily on humidity. On muggy summer days when you need cooling most, the air is already saturated with moisture and can’t accept much more water vapor. This is why cooling tower performance drops when you need it most.
B. Key Performance Parameters
Alright, now let’s talk about how we measure and evaluate cooling tower performance. These four parameters are your diagnostic tools—master them, and you can troubleshoot any cooling tower problem that comes your way.
Approach Temperature: Definition and Significance (typically 5-15°F)
Approach temperature is hands-down the most important single parameter for evaluating cooling tower performance. Here’s how I explain it:
“Approach temperature tells you how close your cooling tower gets to the theoretical perfect performance.”
Definition: Approach temperature is the difference between the cold water leaving your cooling tower and the ambient wet bulb temperature.
Formula: Approach = Cold Water Temperature – Wet Bulb Temperature
For example:
Cold water leaving tower: 78°F
Wet bulb temperature: 70°F
Approach temperature: 8°F
Why this matters so much:
Lower approach = better performance (your tower is getting closer to theoretical limits)
Straight from the Field: Every 1°F increase in approach temperature typically costs a 500 MW plant about $250,000 per year in lost efficiency. That’s why we monitor this parameter religiously.
Range: Hot Water Inlet vs. Cold Water outlet Temperatures
Range is the simplest parameter to understand but critical for proper system design and operation.
Definition: Range is the difference between hot water entering the tower and cold water leaving the tower.
Formula: Range = Hot Water Temperature – Cold Water Temperature
For example:
Hot water from condenser: 95°F
Cold water returning to condenser: 78°F
Range: 17°F
What range tells you:
Higher range: More heat being rejected per gallon of water (good for efficiency)
Lower range: Either less heat load or more water flow than needed
Typical ranges:
15-25°F: Normal operating range for most power plants
<15°F: Possible overcirculation or low heat load
>25°F: High heat load or insufficient water flow
Practical Insight: Range is primarily determined by your heat load and water flow rate—it’s not something you can improve by fixing the cooling tower itself. If range is wrong, look at your circulation pumps or heat exchanger performance first.
Effectiveness: How to Calculate and Interpret Cooling Tower Performance
Effectiveness gives you a percentage score for how well your cooling tower is performing compared to the theoretical maximum possible.
Formula: Effectiveness = Range ÷ (Hot Water Temperature – Wet Bulb Temperature) × 100%
Why I love this parameter: Effectiveness normalizes performance regardless of weather conditions. A tower showing 65% effectiveness is performing consistently whether it’s hot or cold outside.
Cooling Tower Capacity: Understanding Tonnage and BTU/hr Ratings
Finally, let’s talk about how cooling towers are sized and rated. This is where engineering meets business reality.
Cooling Tower “Tons”:
One cooling tower “ton” = 15,000 BTU/hr of heat rejection
This comes from the old ice industry: one ton of ice melting in 24 hours absorbs 15,000 BTU/hr
Not the same as refrigeration tons, which can be confusing
BTU/hr Ratings: Most industrial cooling towers are rated in millions of BTU/hr because the numbers are more practical:
Small industrial tower: 50-100 million BTU/hr
Large power plant tower: 1,000-3,000 million BTU/hr
Here’s how capacity relates to water flow:
Rule of thumb: 500 GPM per MW of heat rejection
For precise calculations: Heat Rejected (BTU/hr) = Water Flow (GPM) × 500 × Range (°F)
Real-world sizing considerations I’ve learned:
Always oversize by 10-15% for fouling factors and performance degradation
Consider future expansion when selecting tower capacity
Account for worst-case weather conditions in your area
Multiple cells provide redundancy but cost more initially
Straight from the Field: Don’t just look at nameplate capacity. Ask about the test conditions (approach, range, wet bulb) used for that rating. A tower rated at 5°F approach performs very differently than one rated at 10°F approach.
There you have it—the fundamental science that makes cooling towers work. Master these concepts, and you’ll be able to walk into any power plant and immediately understand what’s happening in their cooling system. In our next section, we’ll use this foundation to explore the different types of cooling towers and when to use each one.
Now that we understand the science behind cooling, let’s talk about the different tools available to get the job done. Think of this like choosing the right vehicle for a journey—you wouldn’t use a sports car to haul construction materials, and you wouldn’t use a dump truck for a cross-country road trip. Each cooling tower type has its sweet spot, and understanding these differences will make you a much more effective engineer.
A. Natural Draft vs. Mechanical Draft Systems
Design Principles and Physics of Operation
Let me start with natural draft cooling towers—those iconic, hyperbolic concrete giants you see at major power plants. The physics here is beautifully simple: hot air rises. As warm, moist air inside the tower heats up from contact with hot water, it becomes less dense than the cooler outside air. This density difference creates a natural “stack effect” that pulls air up through the tower without any fans or external power.
Cooling Tower Design: Natural Draft Cooling Tower
The hyperbolic shape isn’t just for looks—it’s engineered to accelerate airflow as it rises, just like a venturi nozzle. The narrow middle section speeds up the air, while the wider top allows for smooth exit without creating turbulence that would reduce flow. I’ve always told young engineers: “It’s a 400-foot-tall chimney optimized for moving air, not smoke.”
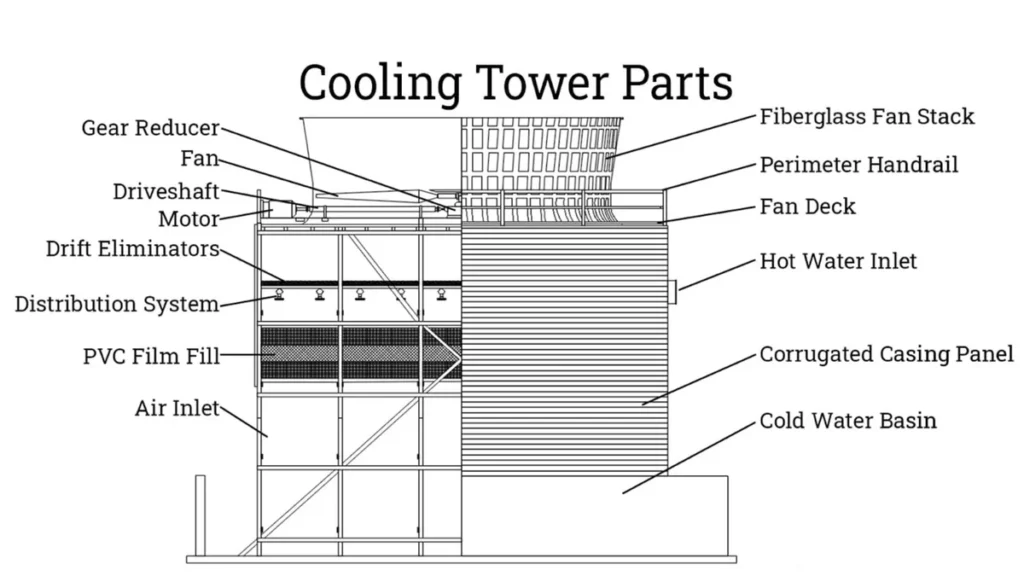
Mechanical draft systems work on a completely different principle—we force the air movement using fans. These come in two flavors: forced draft (fans blow air into the tower from the bottom) and induced draft (fans suck air out from the top). Most power plants use induced draft because it provides better air distribution and keeps the fans away from the hot, moist air intake.
Here’s where engineering meets economics. Natural draft towers have one massive advantage: zero parasitic power consumption. No fans means no electrical load, which in a 1,000 MW plant can save 10-15 MW of internal consumption. Over a year, that’s worth $5-8 million in avoided electrical generation.
But they come with significant limitations. First, they’re climate dependent—they work great in moderate climates but struggle in very hot, humid conditions when the density difference between inside and outside air decreases. Second, they’re enormous. A natural draft tower for a 1,000 MW plant might be 500 feet tall and 400 feet in diameter at the base. That’s a lot of concrete and a lot of real estate.
Mechanical draft towers give you control and flexibility. Fan speed can be varied to match cooling demand, performance is consistent regardless of weather, and they have a much smaller footprint. However, you pay for this with parasitic power consumption—typically ~1% of plant output for the fans and pumps.
Natural Draft vs Mechanical Draft Cooling Tower Comparison
Parameter
Natural Draft
Mechanical Draft
Air Movement Mechanism
Stack effect (hot air rises naturally)
Fans (forced or induced draft)
Power Consumption
Zero (no fans or motors)
~1% of plant output for fans
Shape
Hyperbolic (hourglass)
Rectangular or round
Initial Capital Cost
Very High ($50-100M for large units)
Medium ($10-30M for equivalent capacity)
Minimum Economic Size
>500 MW plant capacity
Any size (scalable)
Performance in Hot Weather
Reduced (less density difference)
Consistent (fan speed controllable)
Performance in Cold Weather
Excellent (high density difference)
Good (may need fan speed reduction)
Climate Dependency
High (stack effect varies with weather)
Low (mechanical control)
Operational Flexibility
Limited (cannot control air flow)
High (variable fan speeds)
Maintenance Requirements
Very Low (no moving parts)
Moderate (fans, motors, drives)
Noise Level
Very Low (no mechanical equipment)
Moderate to High (fan noise)
Site Requirements
Large, stable foundation area
Moderate space, standard foundations
Environmental Permits
Complex (visual, aviation concerns)
Standard industrial permits
Plume Visibility
High (concentrated discharge)
Moderate (distributed discharge)
Part-Load Performance
Poor (cannot reduce air flow)
Excellent (fan speed modulation)
Redundancy Options
None (single large unit)
High (multiple cells possible)
Retrofit Feasibility
Very Difficult (massive construction)
Easy (modular installation)
Capacity Modulation
None (fixed air flow)
Excellent (0-100% fan speed)
Typical Applications
Large baseload power plants
All plant sizes, peak/cycling units
Natural Draft vs Mechanical Draft Cooling Tower
When to Choose Each Type
Here’s my decision framework:
Choose Natural Draft when:
Plant capacity > 500 MW (economies of scale make the high initial cost worthwhile)
Moderate climate with good temperature differentials year-round
Plenty of available land area
Long-term operation planned (25+ years to justify the investment)
Hot, humid climate where natural draft performance would be poor
Limited site area available
Variable load operation requiring quick response to changing conditions
Existing plant retrofits where natural draft construction isn’t feasible
B. Wet, Dry, and Hybrid Cooling Systems
Water vs. Air Cooling Fundamentals
This is where we get to the heart of the environmental and economic trade-offs in cooling system design. Wet cooling systems use evaporation as the primary heat transfer mechanism—remember that 1,000 BTU per pound we discussed earlier. This makes them incredibly efficient but also water-hungry.
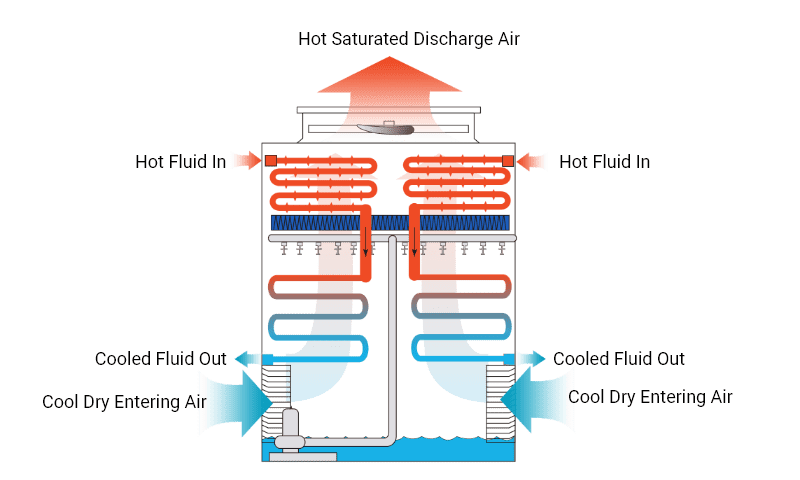
Dry cooling systems rely entirely on sensible heat transfer—think of them as massive automotive radiators. Hot water flows through finned tubes while air flows across the outside, transferring heat purely through temperature difference. No evaporation, no water consumption, but also much larger equipment and higher costs.
Performance Trade-offs and Environmental Considerations
Let me give you the real-world numbers that drive these decisions. A wet cooling system for a 500 MW plant typically consumes about 7,000-8,000 gallons per minute through evaporation and blowdown. That’s over 10 million gallons per day—enough to supply a town of 50,000 people.
Dry cooling systems reduce water consumption by 95% or more, but they come with a performance penalty. In hot weather, when you need cooling most, dry systems can reduce plant output by 5-15% compared to wet cooling. For a 500 MW plant, that 10% penalty represents 50 MW of lost capacity worth $300,000-500,000 per day during peak summer demand.
The environmental considerations are equally important. Wet cooling creates visible plumes that can cause local fogging and icing issues. Dry cooling eliminates these concerns but requires much larger structures that impact the visual landscape.
Aspect
Dry Cooling
Wet Cooling
Water Path
Inside closed tubes
Sprayed into open air
Air Contact
Air touches tube walls only
Air directly contacts water
Evaporation
Impossible (no air-water contact)
Automatic (vapor pressure difference)
Heat Transfer
Sensible heat only
Latent heat (evaporation) + sensible
Water Loss
Zero
1-2% through evaporation
Performance
Limited by air temperature
Limited by wet bulb temperature
Dry Cooling System vs. Wet Cooling System
Hybrid System Design Philosophy
This is where modern engineering brilliance shines. Hybrid systems combine wet and dry cooling to capture the benefits of both approaches. The basic philosophy is simple: use dry cooling when conditions allow (moderate weather), and switch to wet cooling assistance when performance demands it (hot summer peaks).
A typical hybrid system might be sized as 70% dry cooling and 30% wet cooling assistance. During moderate weather, the dry section handles the full load with no water consumption. When ambient temperatures rise above design conditions, the wet section activates to maintain full plant output. This approach can reduce water consumption by 60-80% compared to full wet cooling while maintaining peak performance capability.
Hybrid Cooling Tower: Dry Mode
C. Configuration Options
Counterflow vs. Crossflow Heat Transfer Principles
These terms describe how air and water move relative to each other, and the choice significantly impacts performance and cost. In counterflow towers, air moves vertically upward while water falls straight down—they meet head-on. This creates the maximum temperature difference between fluids throughout the tower height, resulting in the most efficient heat transfer.
Crossflow towers allow air to move horizontally through the falling water. This is less thermodynamically efficient because air and water temperatures approach each other more gradually. However, crossflow designs are often easier to maintain because the water distribution system is accessible from outside the air stream.
From my experience, counterflow gives you about 10-15% better thermal performance in the same tower volume, but crossflow can be 20-30% less expensive to build and maintain.
Single vs. Multiple Cell Arrangements
This decision comes down to reliability versus cost. A single large cell is more economical to build and operate—one big fan, one water distribution system, simpler controls. But if that fan fails during peak summer, you lose your entire cooling capacity.
Multiple cells provide redundancy and operational flexibility. If one cell goes down for maintenance, the others keep running. You can also modulate capacity by taking cells in and out of service as cooling demand changes. For critical baseload plants, I always recommend at least two cells, preferably three or four for large installations.
Fill Types: Film vs. Splash Principles
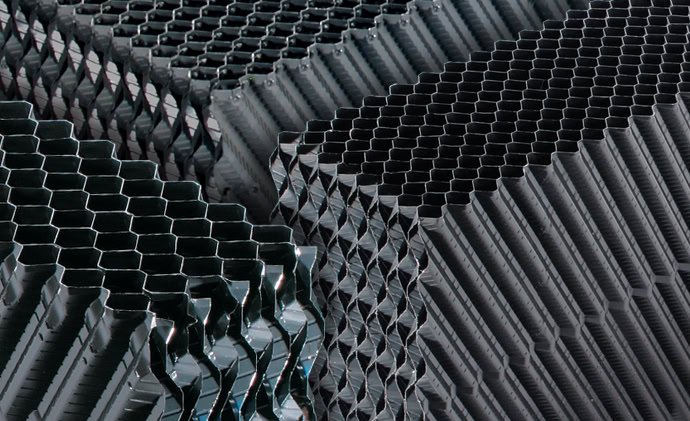
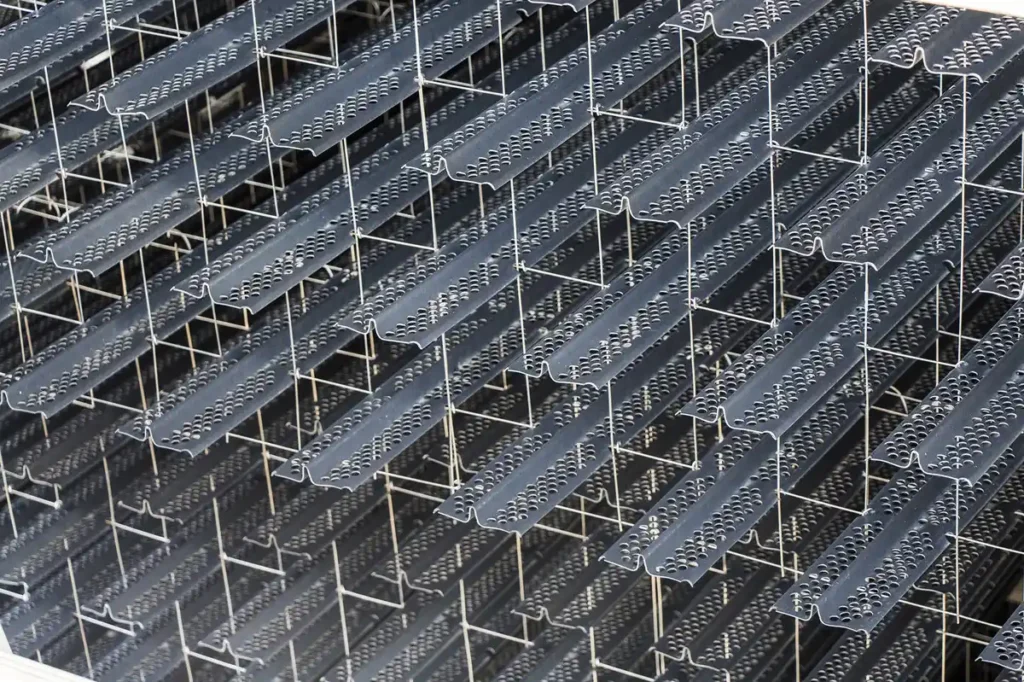
Finally, let’s talk about the heart of the heat transfer process—the fill material where water and air actually exchange heat. Film fill creates thin sheets of water flowing over closely spaced surfaces, maximizing the water-air interface. This gives excellent heat transfer performance but is susceptible to fouling from dirt, debris, or biological growth.
Film fill
Splash fill breaks water into droplets that cascade through multiple levels of splash bars. It’s much more tolerant of poor water quality and easier to clean, but provides less heat transfer surface area per unit volume.
Splash fill
My rule of thumb: use film fill when you have good water quality and can maintain regular cleaning schedules. Choose splash fill for applications with poor water quality, high debris loads, or limited maintenance resources.
The key insight I always share with young engineers is this: There’s no universally “best” cooling tower type. The optimal choice depends on your specific combination of plant size, climate, water availability, environmental constraints, and economic priorities. Master these fundamentals, and you’ll be able to make informed decisions that serve your projects well for decades to come.
Design Calculations and Sizing
Now let’s get our hands dirty with the actual numbers that drive cooling tower design. This is where theory meets the real world of engineering calculations. I’ve seen too many young engineers struggle with these fundamentals, so we’re going to work through this step-by-step with real examples you can use in practice.
Heat Rejection Calculations
The Foundation: Plant Heat Balance
Every cooling tower design starts with understanding exactly how much heat you need to reject. Here’s the fundamental relationship that drives everything:
Practical Tip: Always add a 10-15% safety margin to your heat rejection calculations. Condenser fouling, off-design conditions, and future plant modifications can increase the actual heat load.
Condenser Heat Balance Verification
Here’s how to double-check your numbers using condenser data:
Maximum coincident humidity: Usually occurs with high wet bulb
Example Design Conditions (Houston, Texas):
Design dry bulb: 95°F
Design wet bulb: 78°F
Coincident humidity: 65%
Performance Margins and Safety Factors
Here’s my recommended approach for bulletproof designs:
Heat Rejection Margin:
Base heat rejection: 100%
Condenser fouling allowance: +10%
Future plant modifications: +5%
Design heat rejection: 115% of calculated
Approach Temperature Margin:
Target approach at design conditions: 7°F
Performance degradation allowance: +3°F
Design approach: 10°F maximum
Water Flow Margin:
Calculated flow: 100%
Fouling and aging: +10%
Operational flexibility: +5%
Design water flow: 115% of calculated
Seasonal Performance Verification
Always verify your design will perform adequately year-round:
Summer Peak (Design Day):
Wet bulb: 78°F, approach: 10°F
Cold water temperature: 88°F
Verify adequate condenser vacuum
Winter Operation:
Wet bulb: 35°F, approach: 5°F
Cold water temperature: 40°F
Check for overcooling and freezing issues
Shoulder Seasons:
Wet bulb: 55°F, approach: 6°F
Cold water temperature: 61°F
Verify good part-load performance
Design Documentation Checklist
Before finalizing your cooling tower design, verify:
✓ Heat balance calculations match plant design basis ✓ Water flow provides adequate condenser ΔT at all loads ✓ Pump sizing includes all system head losses and margins ✓ Fan sizing provides adequate airflow at design wet bulb ✓ Approach temperature maintained at worst-case conditions ✓ Parasitic power consumption optimized for lifecycle costs ✓ Performance verified for all seasonal operating conditions ✓ Safety margins included for fouling and degradation
Final Engineering Wisdom: A cooling tower that meets performance requirements 99% of the time isn’t good enough. That 1% when it falls short will likely be during peak summer demand when electricity prices are highest and your plant revenue is most at risk. Size conservatively, operate efficiently, and sleep well at night knowing your cooling system won’t let you down when you need it most.
Conclusion and Design Checklist
You now have the theoretical foundation that separates competent cooling system engineers from those who simply follow vendor recommendations. The key insight I want you to remember is this: every cooling system design is a balance between performance, economics, and environmental constraints—there’s no universal “best” solution.
Key Decision Factors Summary
Your cooling system selection should always consider these critical factors in order of importance:
Plant size and load profile (baseload vs. peaking determines natural vs. mechanical draft)
Water availability and cost (drives wet vs. dry vs. hybrid decision)
Climate conditions (wet bulb temperature sets performance limits)
Site constraints (space, soil conditions, environmental permits)
Economic lifecycle analysis (25-year NPV including water, energy, and maintenance costs)
This theoretical foundation prepares you for the real world of cooling tower operations. In Part 2 of our series, we’ll dive deep into the practical challenges you’ll actually face: troubleshooting performance problems on hot summer days, implementing maintenance programs that prevent costly failures, and optimizing operations for maximum efficiency and reliability.
Theory gets you hired—practical expertise keeps plants running and advances careers.


One Comment
Comments are closed.